Ear2Earth User Guide
Introduction
This is a walkthrough to introduce users to the more complex features of Ear2Earth. This guide will introduce users to features such as sound module selection, metadata, sensor selection, and much more.
1. Getting Started
1.1 Data Selection Menu
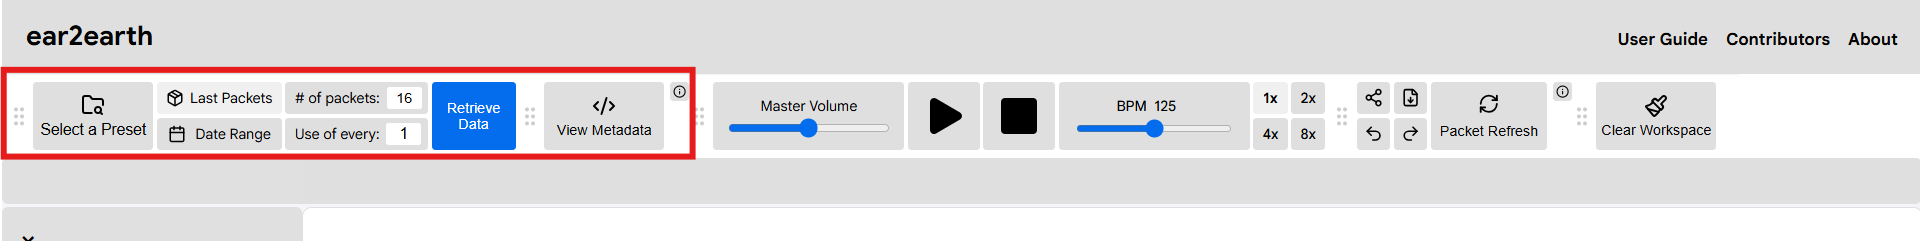
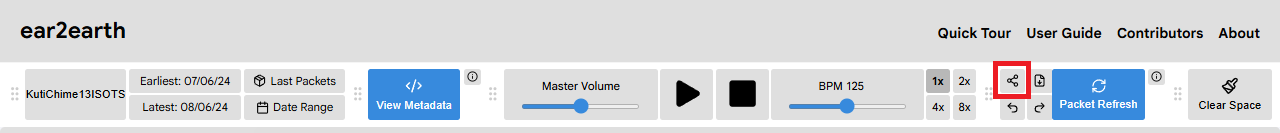
The data selection menu is represented by all options within the top menu's left area. Users can select database presets, choose between packet options, retrieve data, and view metadata.
1.2 Playback Menu
The playback menu is represented by all options within the top menu's mid-area. Users can play tracks, pause/stop tracks, and modify the BPM.

1.3 Sound Module Selection
Users can select from a variety of sound options to personalize their musical experience. These options include the tonic, instrumentation, scale, and tessitura.
1.4 Tracks
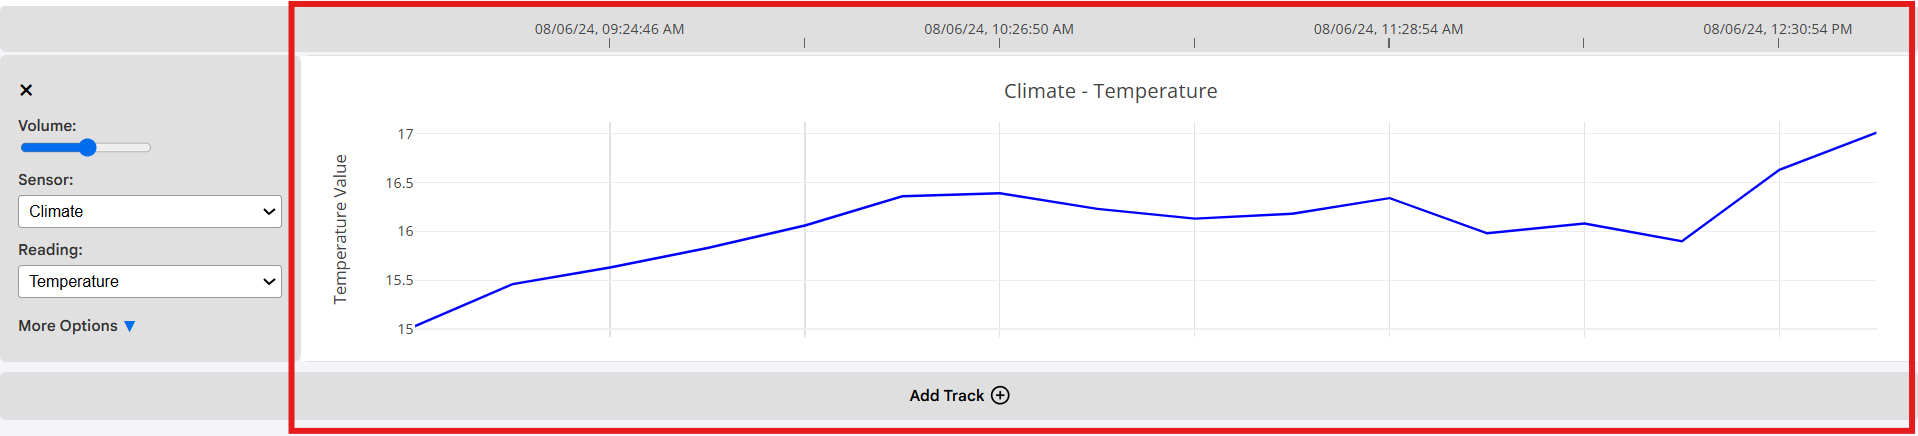
Users can view their data in the form of a line graph. Each data point is associated with an individual note. As the the data climbs higher in the y-axis, the notation follows. The same idea applies to lowering data.
1.5 Additional Functions
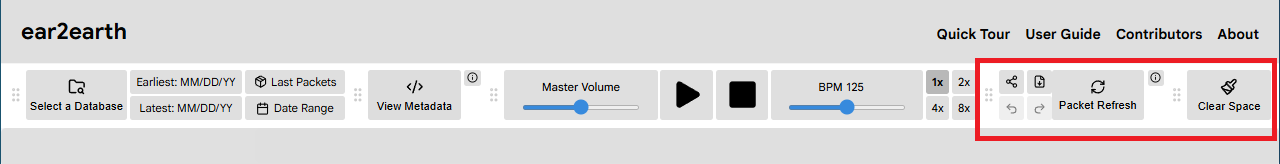
In the rightmost area of the top menu, users can find additional functions such as 'Clear Workspace' and 'Refresh Packets.' These functions will be explored in more detail in Section 8.
2. Selecting Data
2.1 Selecting Databases and Devices
Ear2Earth has a variety of databases, each with its own unique collection of data. Each database contains multiple devices, and each device contains multiple sensors. For example, the 'TEK_Cascade' database contains the device 'KutiChime13ISOTS,' which contains sensors such as 'Climate,' 'Light,' and 'Battery Voltage.'
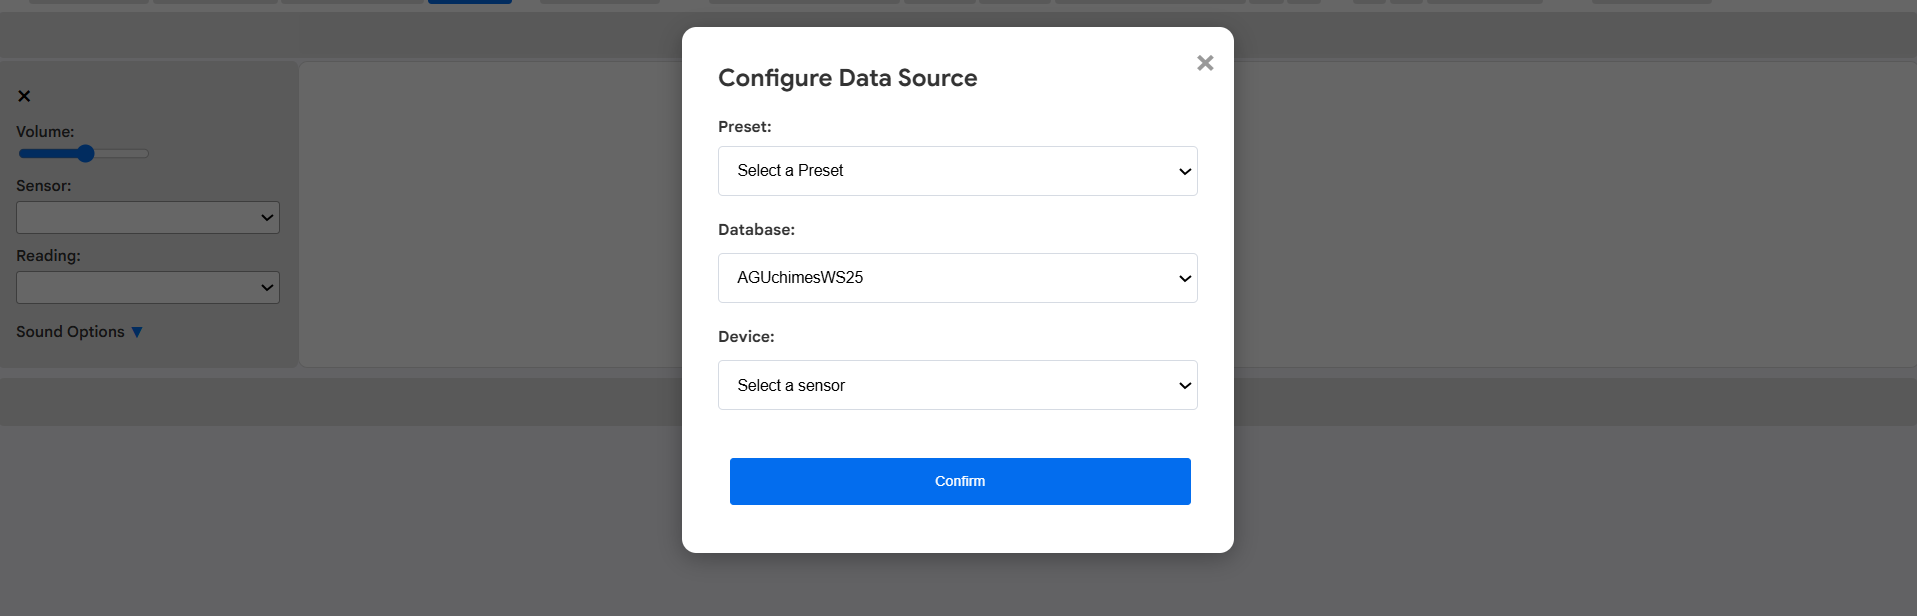
Users can select a database/device pair by first selecting 'Select a Database' from the top menu:

From here, a selection menu will appear, allowing users to select a database/device pair. Users can also select a preset, which is a pre-selected database/device pair. Presets are curated by the Ear2Earth team and are a great starting point for new users. When a database/device pair is selected, click 'Retrieve Data' to retrieve the data and generate a track. We will explore data retrieval in more detail in the following sections.
2.2 Selecting Most Recent Packets
In our context, a "packet" refers to one data point retrieved from a sensor. Each packet contains measurements for all of the sensor's readings, and all measurements are taken at the same time.
This collection is representative of a single time frame. For example, a packet retrieved from the "Cascade Creek"
preset provides the user with measurements for climate, light, hydrostatic pressure, atmospheric pressure, rainfall
gauge, and soil moisture, all collected within a single second.
There are two methods of packet retrieval. The first method is the selection of the most recent packets. This method retrieves
the most recent packets in the database, with the number of packets retrieved being determined by a timeframe selected by the
user. This method is ideal for users who want to view the most up-to-date data and trends.
Users can select 'Last Packets' from the top menu to select this method of retrieval:

This will prompt a selection menu to appear, prompting users to select a timeframe. For example, selecting '4 months' will retrieve packets from the most recent 4 months data has been collected. There is also a 'Use of every:' option, which allows users to choose the number of packets to skip after each retrieval. For example, if a user selects 'Use 1 of every 2 packets,' for every packet retrieved, the following packet will be ignored.

2.3 Selecting a Time Range
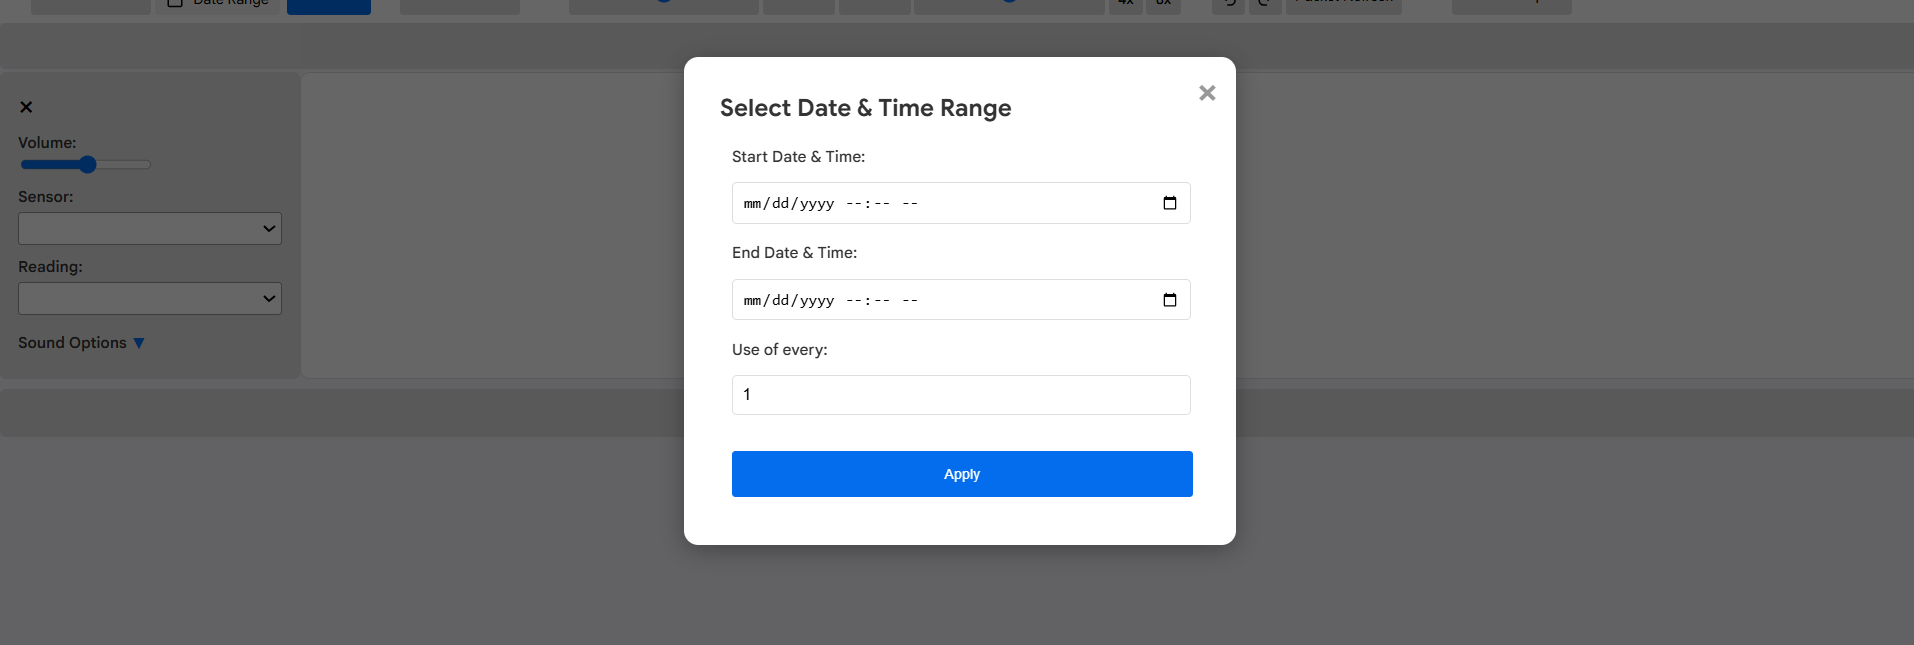
The second packet retrieval option is the selection of a time range. First, users must select the 'Date Range' option:

Users will then be brought to a selection menu where they can select a start date and an end date. This method is ideal for users who want to view data from a specific time period, such as a particular season or year. Note that date ranges are automatically selected to be the earliest and latest dates available in the database. Users can modify these values to be any dates greater than the earliest date and less than the latest date, keeping in mind that the rightmost date must always be greater than the leftmost date. There is also a 'Use of every:' option, which allows users to choose the number of packets to skip after each retrieval. For example, if a user selects 'Use 1 of every 2 packets,' for every packet retrieved, the following packet will be ignored.
3. Retrieving Metadata
3.1 Fetching Metadata
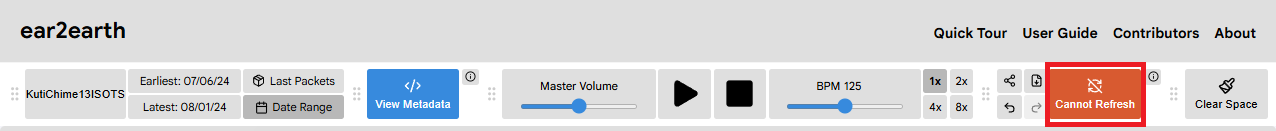
Databases may have a metadata packet that provides information on the sensor's deployment data, latitude and longitude data, and the owner of the sensor. To determine if a database/device pair has metadata associated with it, select a database in the top menu. The metadata retrieval button will automatically indicate whether or not metadata was retrieved. If the button is blue, metadata can be retrieved. If the button is red, metadata cannot be retrieved.


3.2 Interpreting Metadata
If metadata is available, select 'View Metadata' to view the information. The retrieved metadata will present the user with the following four categories:
- Deployment Date
- Latitude
- Longitude
- Owner
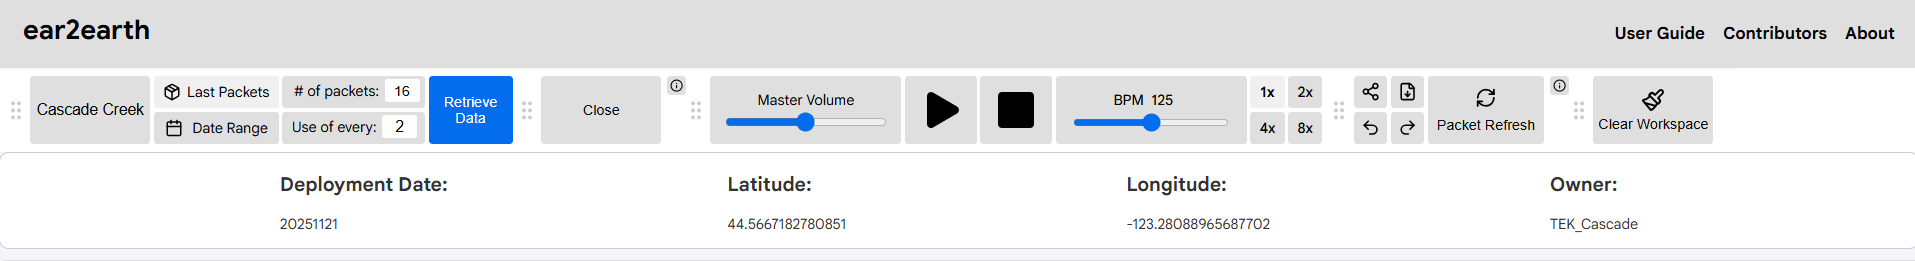
The deployment date is representative of when the database was first placed and began to retrieve data. The latitude and longitude values represent the physical coordinates of each dataset. Finally, the Owner attribute represents the team or individual in charge of the sensor.
4. Interpreting Tracks
4.1 Understanding the Axes
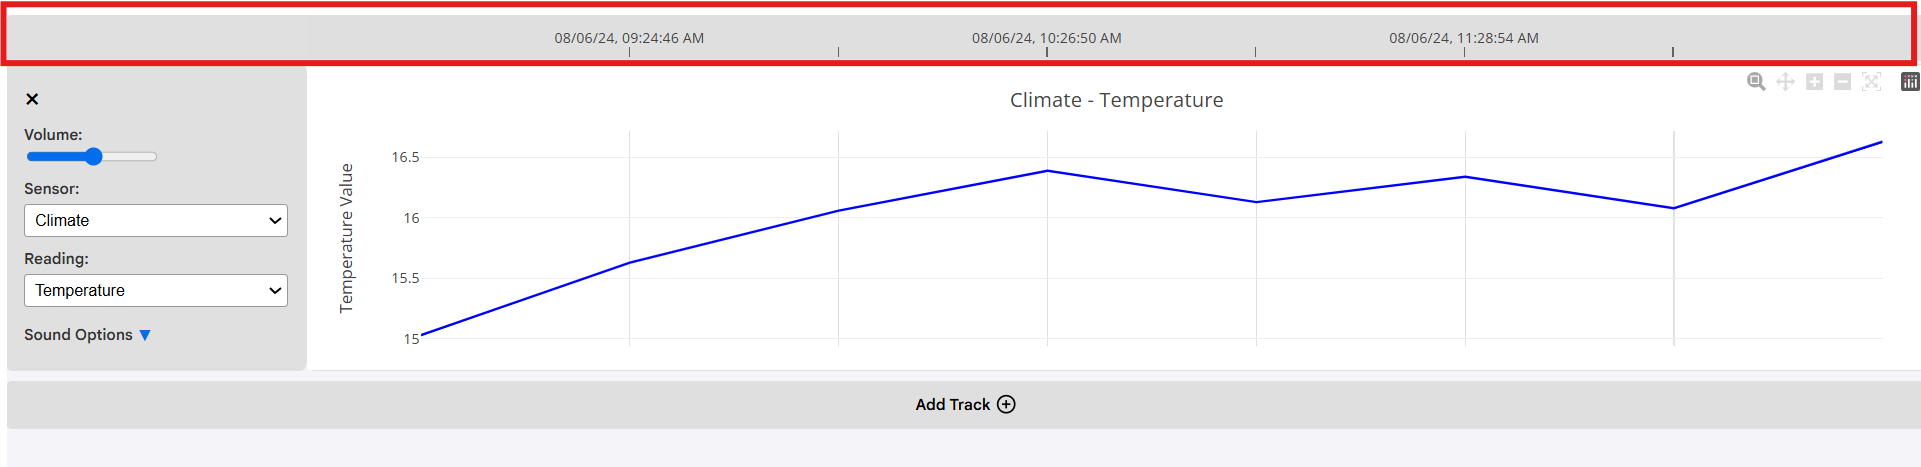
The retrieved environmental data is interpreted as line graphs. As the trends in data increase, and the line gets visually higher, the notation will also become musically higher. For data trends that decrease, the visual line and notation simultaneously get lower. Users can add multiple tracks coinciding with the selected dataset. All tracks share the same x-axis, which is above all graphs. The x-axis represents time stamps, which will be universal across all data points in a given dataset.
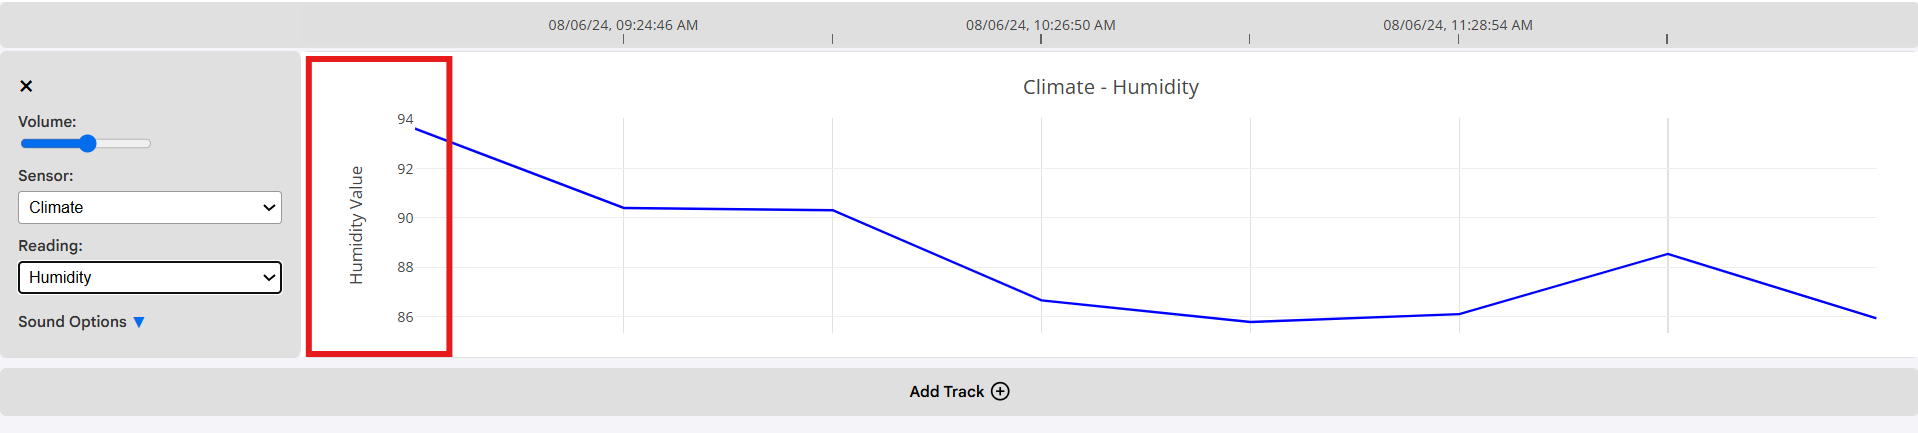
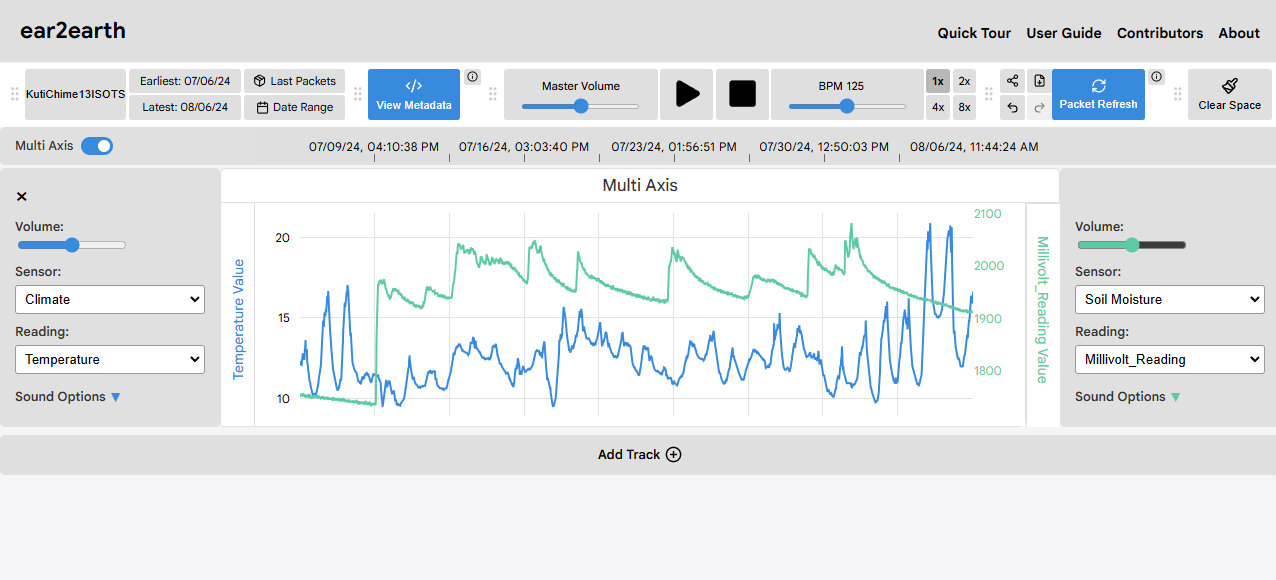
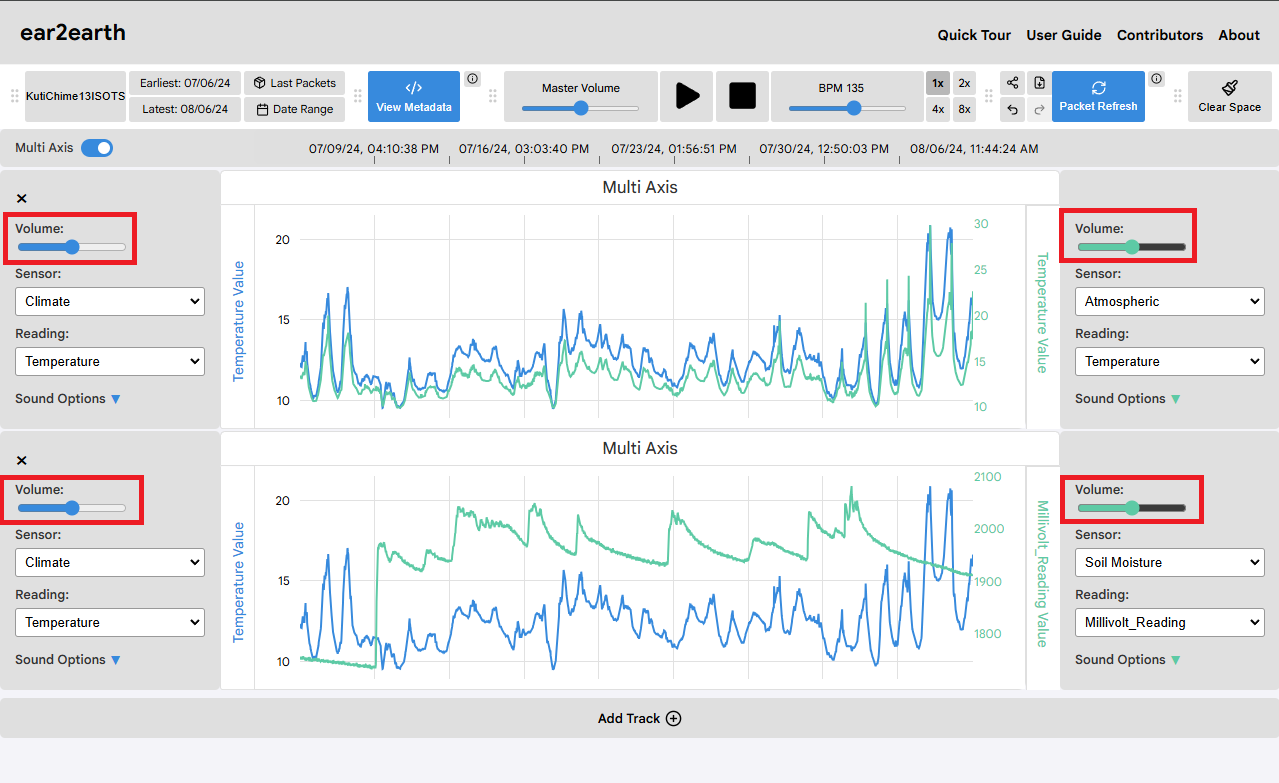
Each track will have a unique y-axis consisting of measurements relevant to its sensor and reading. For example, the image below shows data from the 'TEK_Cascade'/'KutiChime13ISOTS' database/device pair. The 'Climate' sensor is measuring 'Temperature' readings, and 'Soil Moisture' is reading 'Millivolt_Reading' measurements. The y-axis for the 'Climate' sensor is in degrees Celsius, while the y-axis for the 'Soil Moisture' sensor is in millivolts.
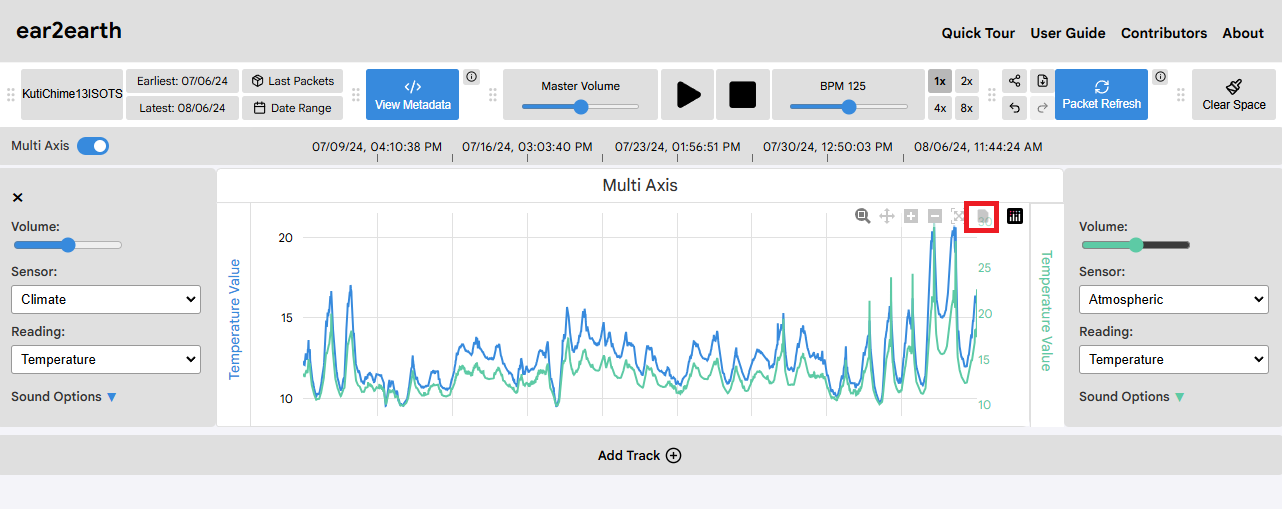
4.2 Setting the Multi-Axis
Users can customize their tracks further by setting the multi-axis. This feature allows users to view two readings on the same graph, with a new y-axis presented on the right side of the graph. This is ideal for users who want to view correlations between two readings. To set the multi-axis, retrieve data for a sensor and reading, then select 'Multi Axis' from the upper x-axis.
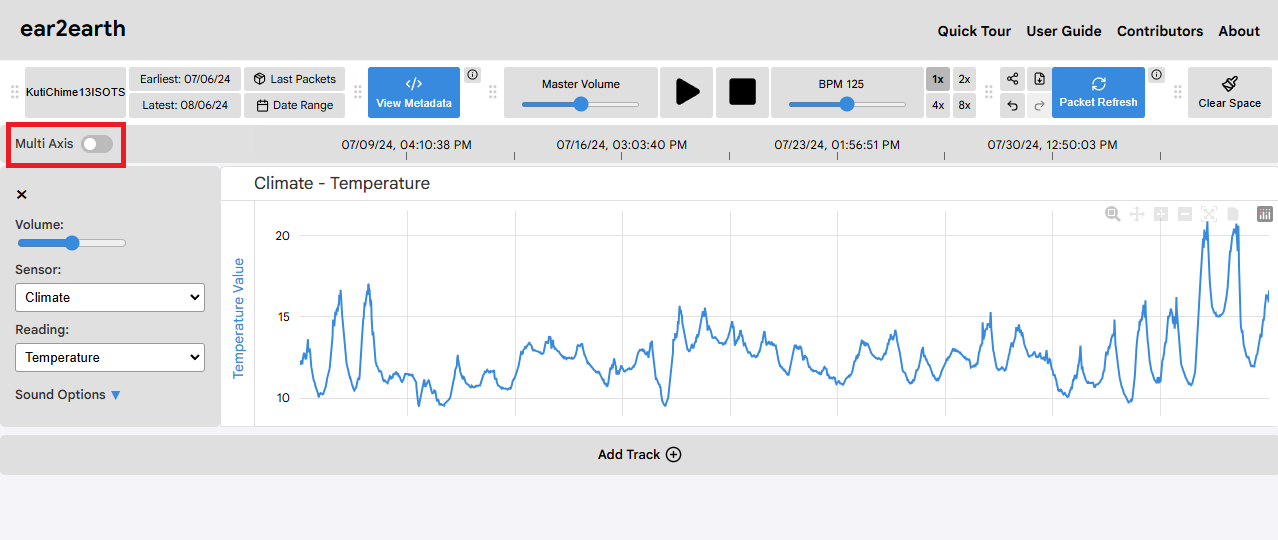
Customizing sensors and readings will be explored in more detail in Section 6.
5. Setting Playback Options
5.1 Playing and Pausing Tracks
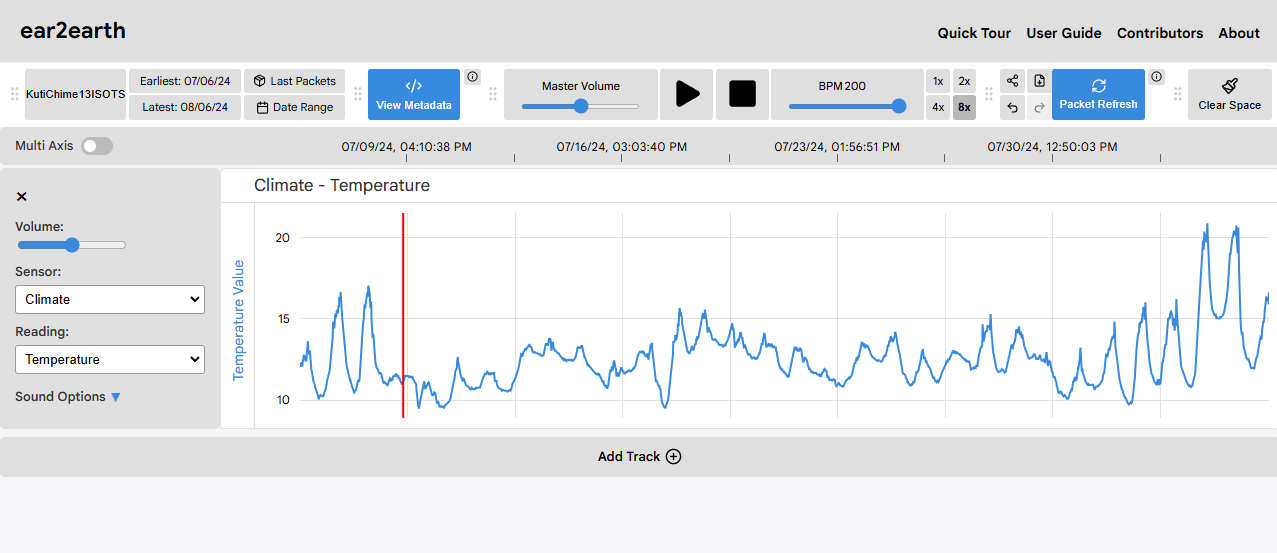
After data has been retrieved and a track is displayed, users can begin to play music by selecting the 'play' button in the top menu:
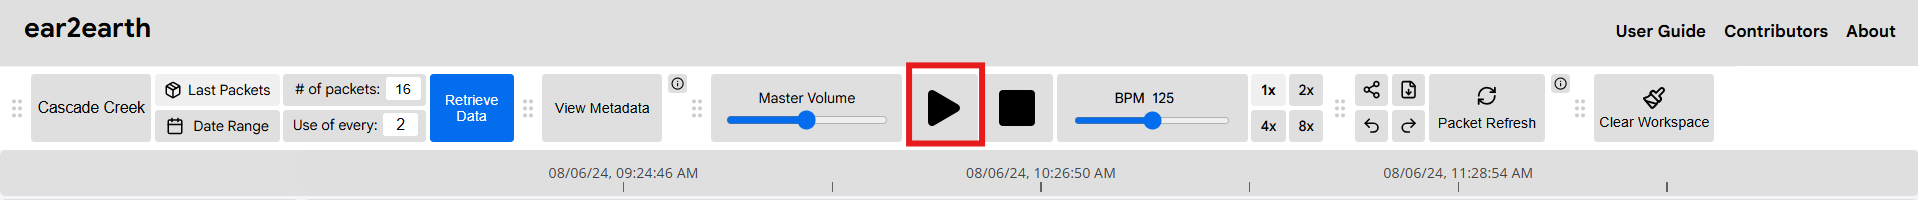
Music will begin playing and a visible progress bar will move from left to right, following the music and the timestamps represented by the x-axis. The music will loop back to the beginning if it reaches the end point of the graph.
In order to pause a track, press the 'stop' button. When 'play' is clicked again, the music will resume from where it was paused.

5.2 Modifying the BPM
Users can control the speed of the music by making changes to the number of beats-per-minute, or BPM. This will change the speed of the music. There are two ways to change the BPM. First, users can drag the slider in the top menu to the right or left to increase or decrease the BPM respectively. With a minimum of 50 BPM and a maximum of 200 BPM, users can set exact values with the slider.

Secondly, users can select from four different speed modifiers. Each modifier will multiply the current BPM (as indicated by the slider) by a specific value. The options include '1x,' '2x,' '4x,' and '8x.' These modifiers are ideal for users who want to quickly change the BPM without dragging the slider to an exact value.

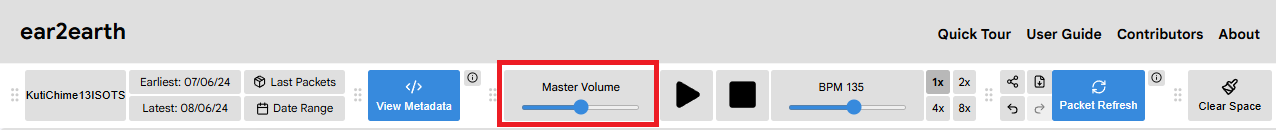
5.3 Changing the Volume
Users can also change the volume of the music. This can be done in two ways. First, users can drag the master volume slider in the top menu to the right to increase the volume and to the left to decrease the volume. This will modify the overall volume of all tracks.
If users want to change the volume of a specific track, they can do so by dragging the track's individual volume slider. This will modify the volume of a specific track without affecting the volume of other tracks. This is ideal for users who want to emphasize or de-emphasize the music generated by a specific sensor or reading. The volume modifier for an individual track is above its associated sound options. Track volume can also be modified for both axes of a multi-axis track.
6. Selecting Sensors and Readings
6.1 Understanding Sensors and Readings
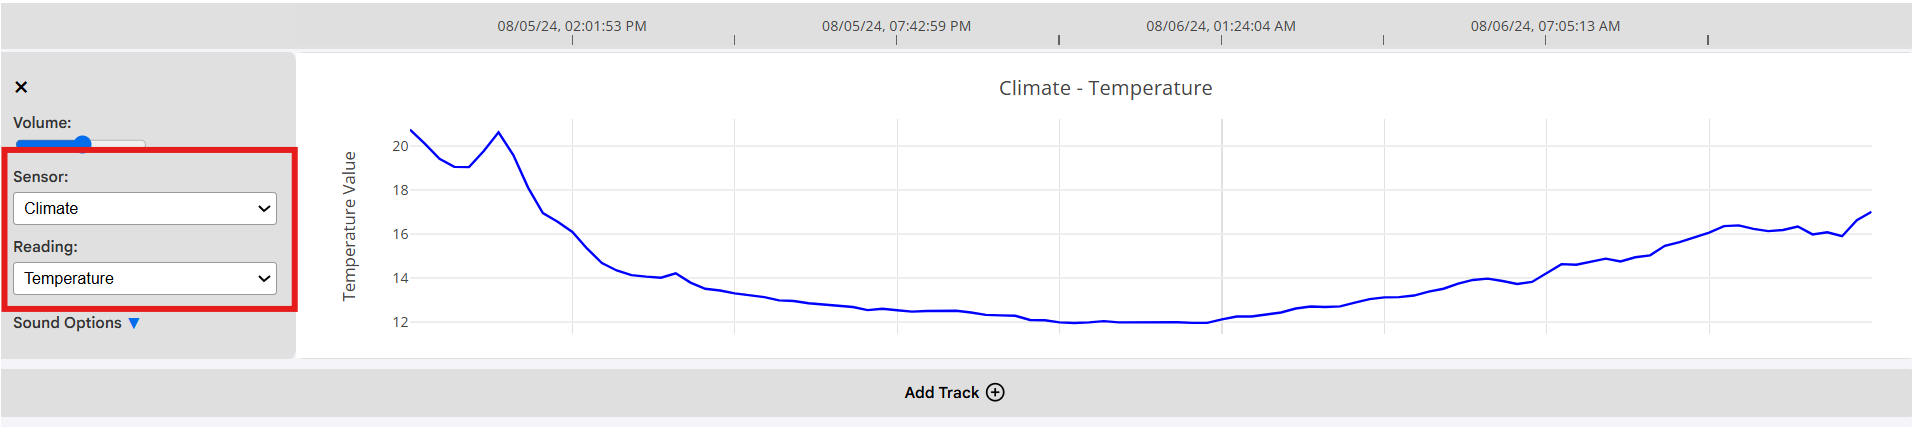
When a user selects a data preset and retrieves its data, they have the option to select a sensor and a reading. Each sensor is unique, tracking data that is relevant to its focus. For example, under the 'Cascade Creek' preset, the 'Climate' sensor tracks 'Temperature' and 'Humidity.' In this example, the temperature and humidity represent the sensor's readings. Readings measure an environmental variable and contain a unique y-axis. Note that sensors can measure the same type of reading. However, the data will differ, as its measurements are in relation to its associated sensor. For example, both 'Climate' and 'Hydrostatic Pressure' sensors have 'Temperature' readings. While they both measure the same type of data, the sensors measure the climate temperature and hydrostatic pressure temperatures respectively.
6.2 Connecting Different Tracks
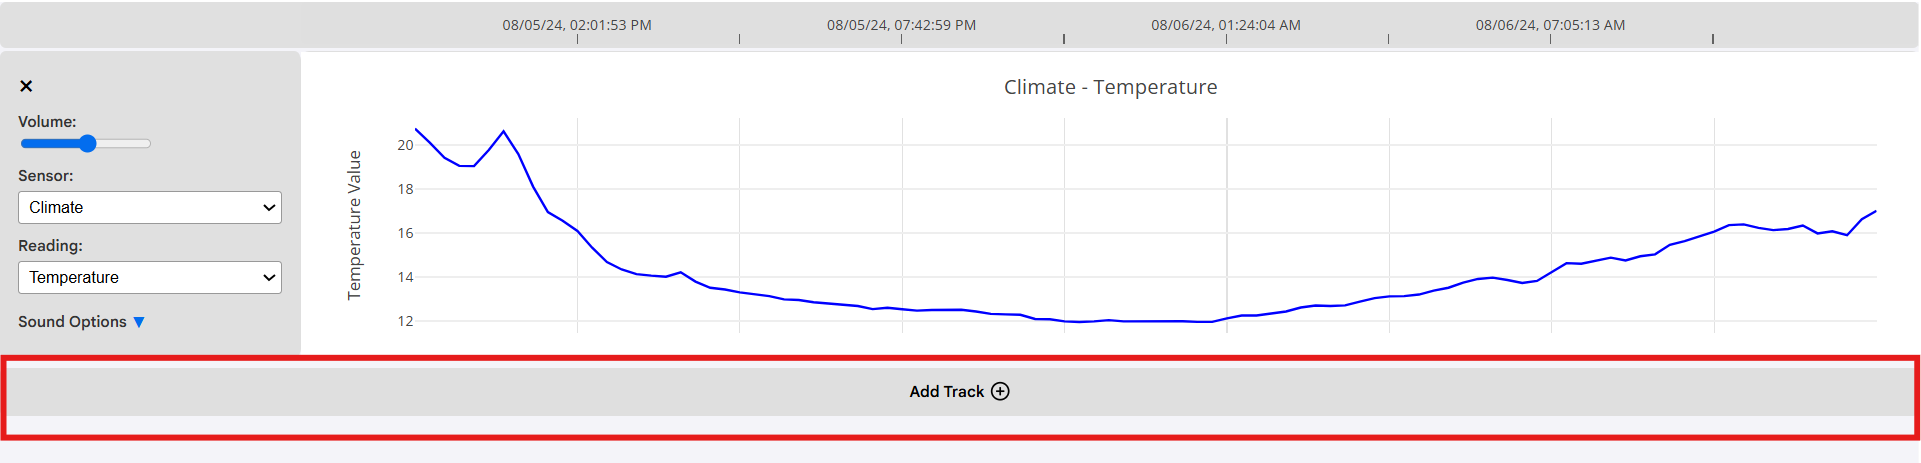
Users can create new tracks by selecting 'Add Track' below the most recently-selected one.
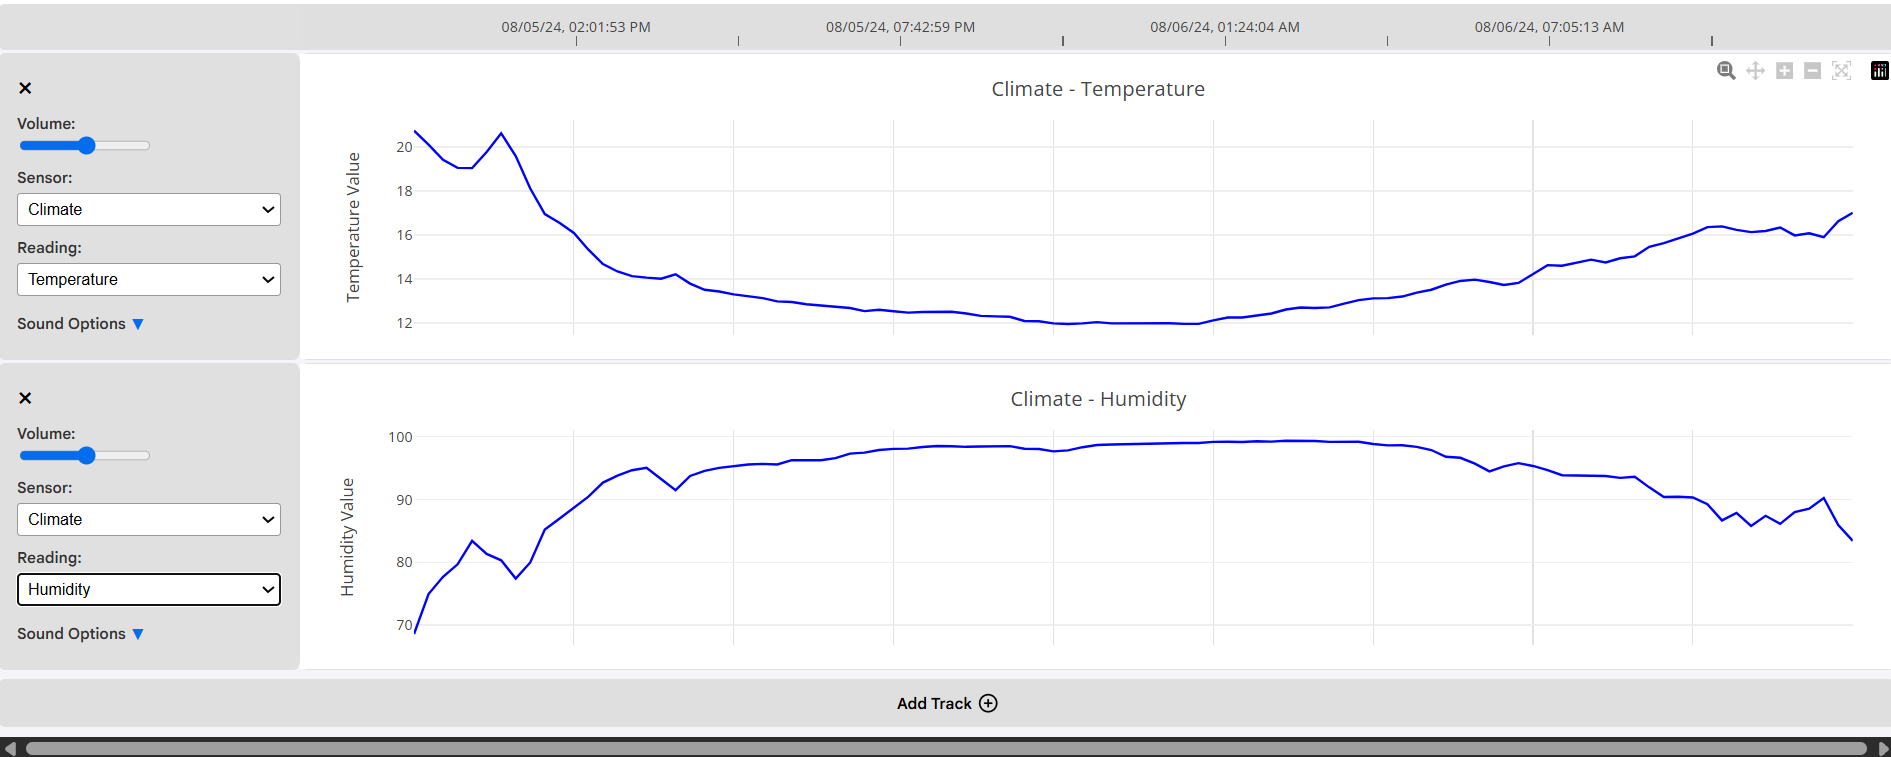
Users can select different sensors and readings for new tracks. All of the data will follow the timestamps represented by the universal x-axis. This allows users to see correlations in data between different environmental variables, seeing how data trends work alongside one another under specific conditions.
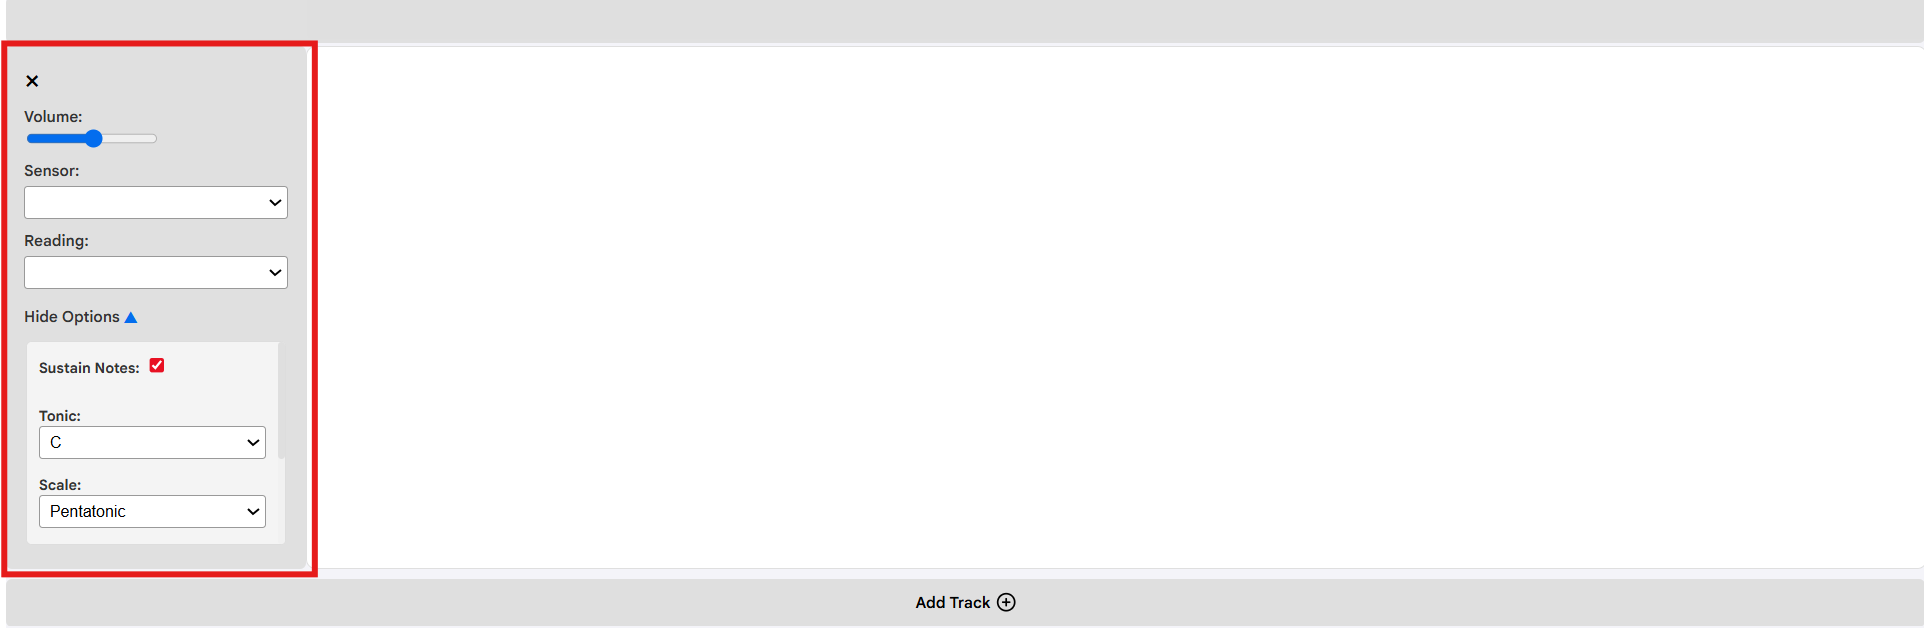
7. Choosing Sound Module Options
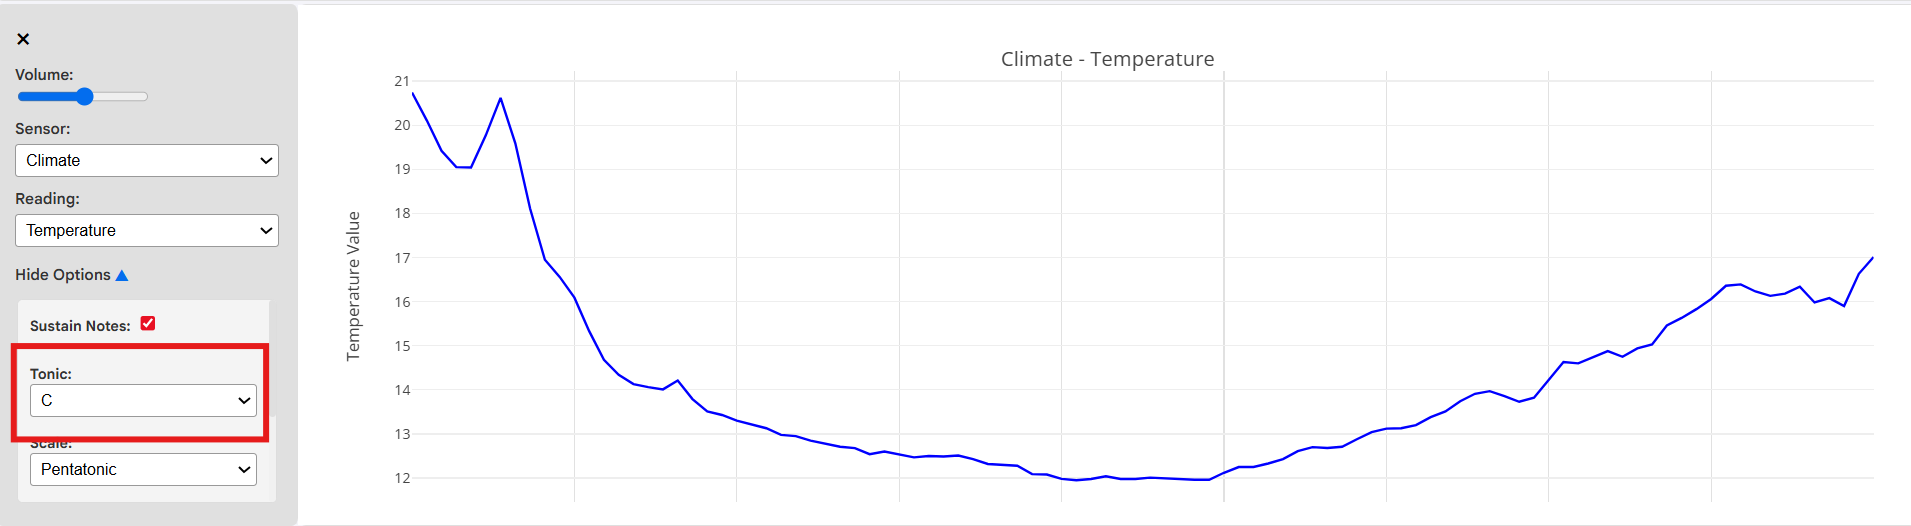
7.1 Selecting the Tonic
There are a variety of sound options a user can choose from. To view them, select the dropdown titled 'Sound Options' for a given track. Firstly, the 'Tonic' is the root note of the music being played. The tonic is the first note of a scale and serves as the home base for the music. For example, if a user selects 'C' as the tonic, the music will be based on the C major scale, and the note C will be the most prominent note in the music.
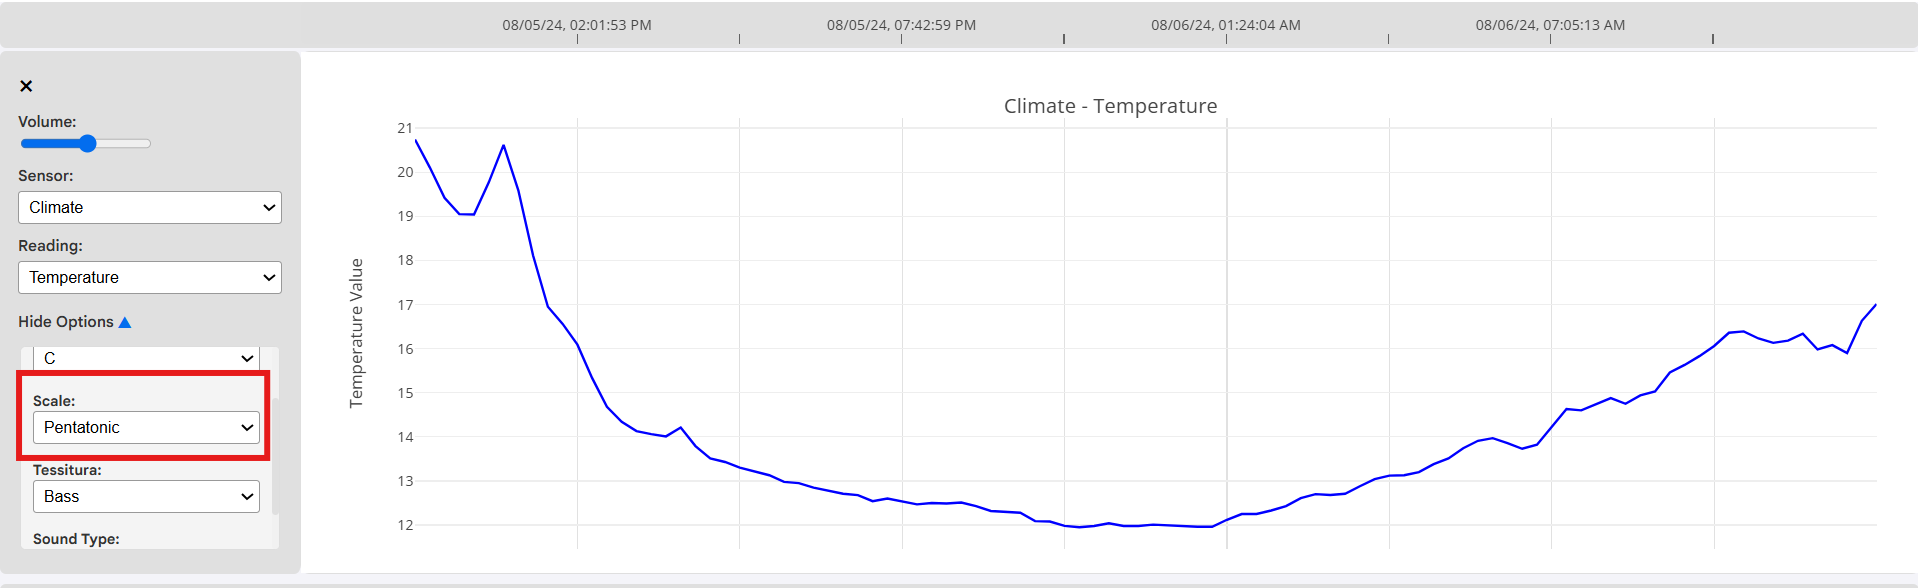
7.2 Selecting the Scale
The 'Scale' option denotes the specific set of musical notes that will be played. Each scale has a unique sound and feel, evoking different emotions and atmospheres.
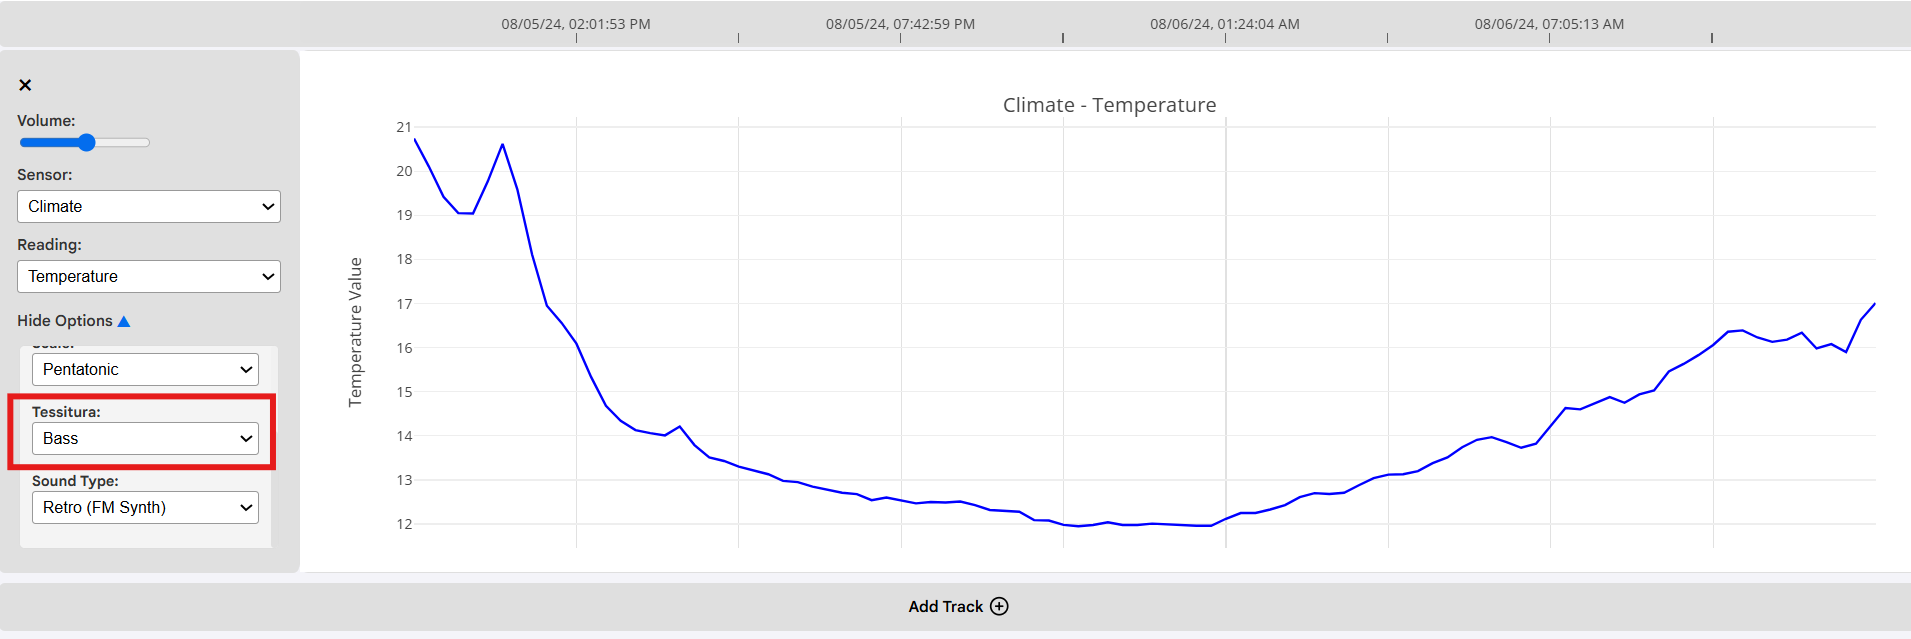
7.3 Selecting the Register
The 'Register' represents the musical range that will be played. The options range from as high as soprano to as low as bass. The register is ideal for users who want to modify the pitch range of their music.
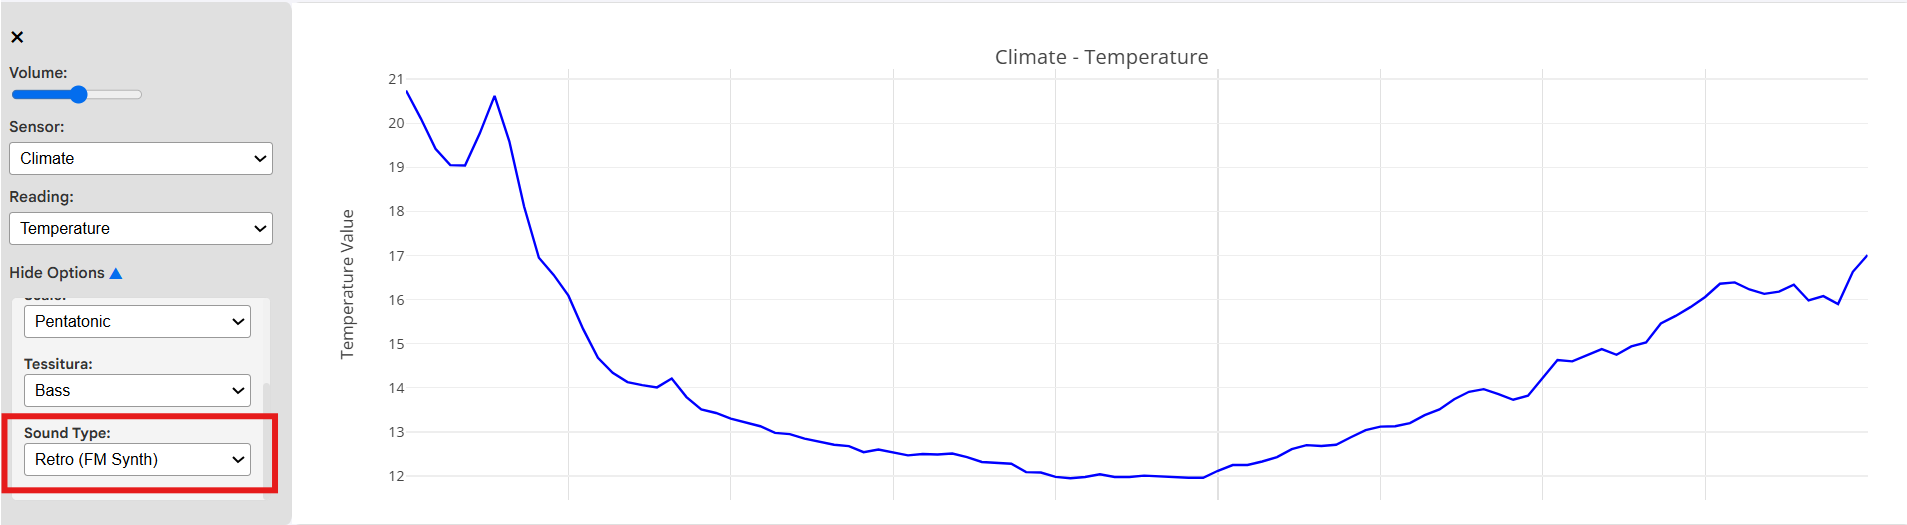
7.4 Selecting the Sound Type
Finally, the 'Sound Type' is a wide selection of instruments for users to fully personalize their musical experience.
8. Miscellaneous Features
8.1 Zoom and Autoscale
After retrieving data, users can select a specific area of the graph to view in more detail. To do this, first hover the cursor over the graph. A selection menu should appear. From there, select 'Zoom'.
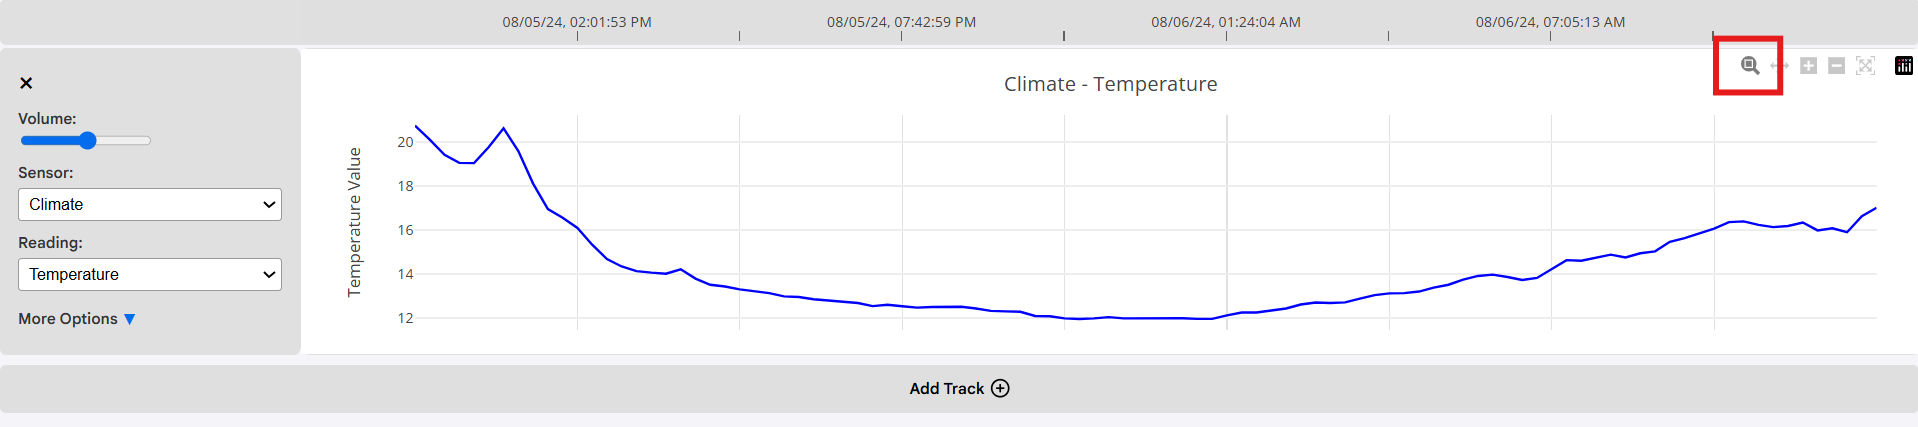
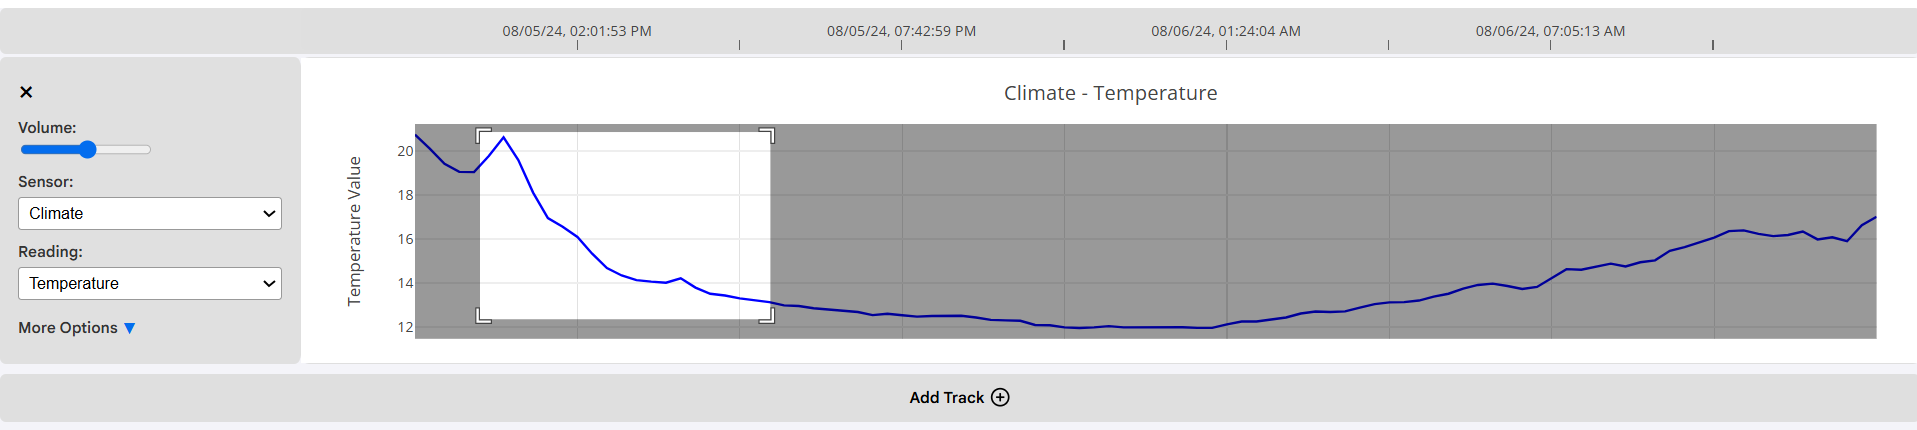
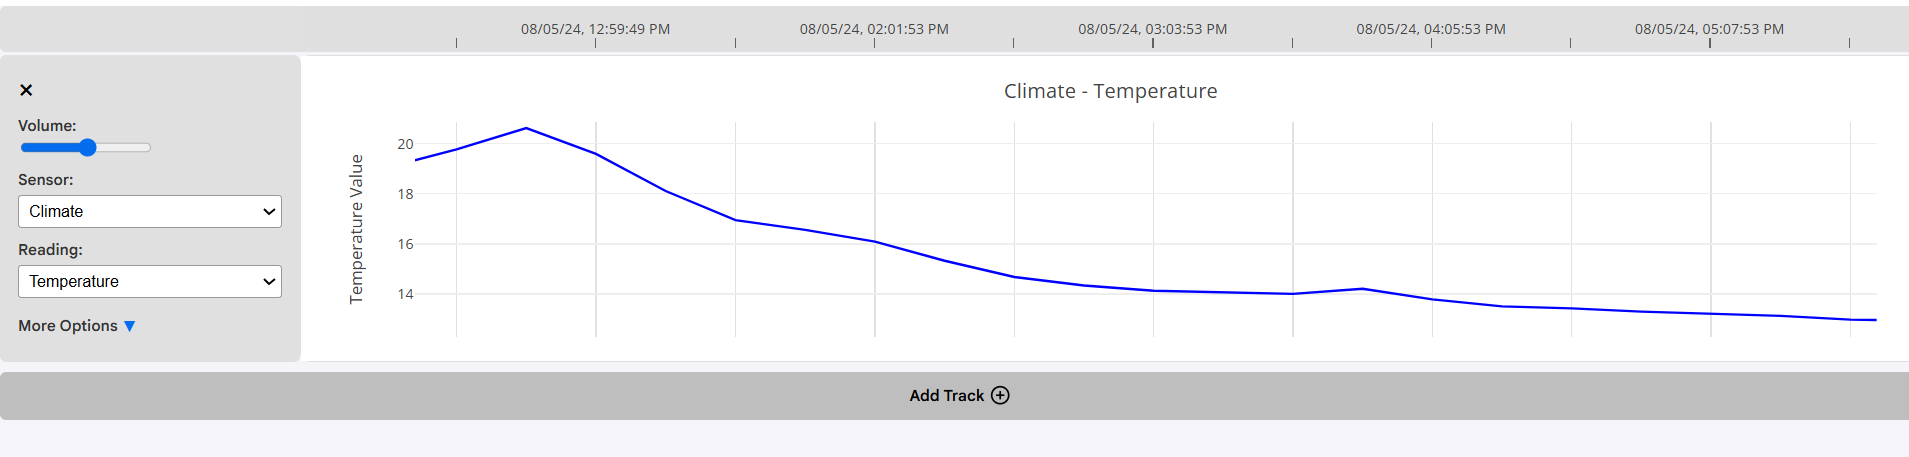
The Zoom tool allows users to drag their cursor to create a rectangle. Whatever is highlighted within this rectangle will become the new graph. This is ideal for users who want to view specific trends in their data more closely.
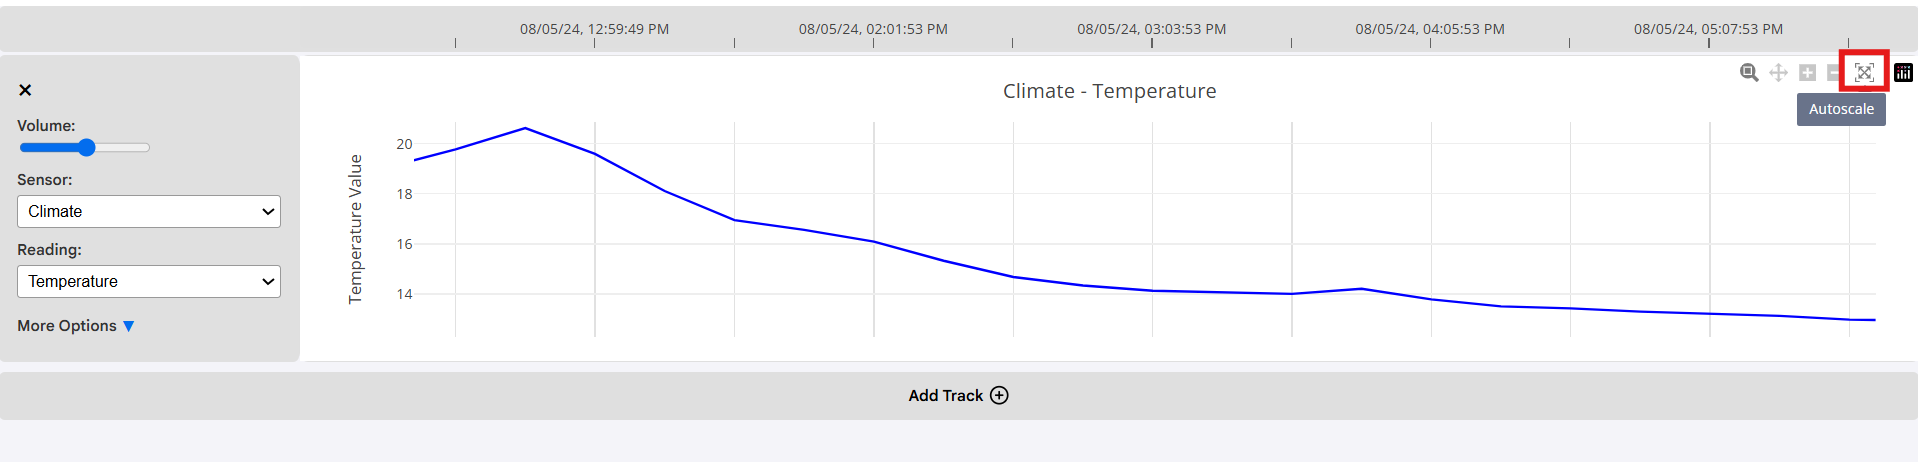
To retreive the original, full graph, hover over the track once again. Select 'Autoscale' from the selection menu. This will return the graph to its original form, showing all data points and trends.
8.2 Zoom Out/Zoom In
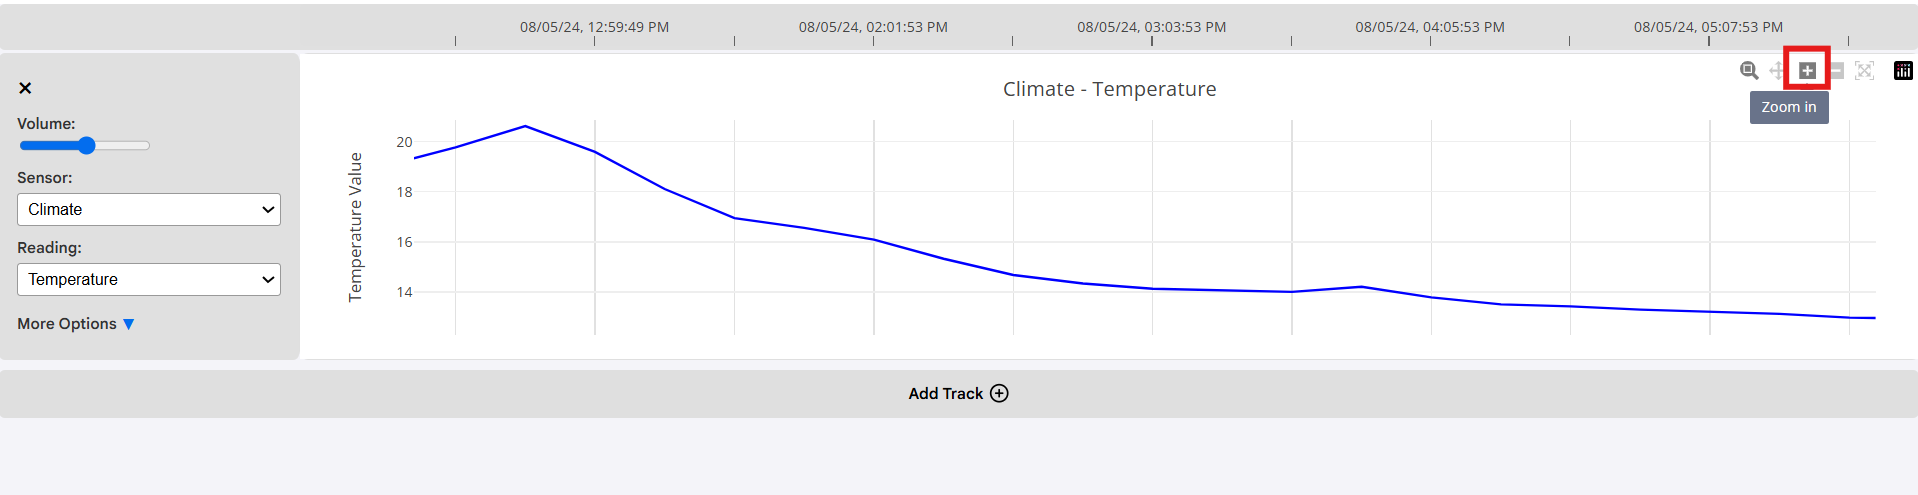
The tracks also allow users to zoom-in and zoom-out from the center of the graph. Hover over the graph to view the selection menu and select 'Zoom In'. This will zoom in from the center of the graph, showing a smaller range of data points and trends. This is ideal for users who want to view their data in more detail but do not want to select a specific area of the graph.
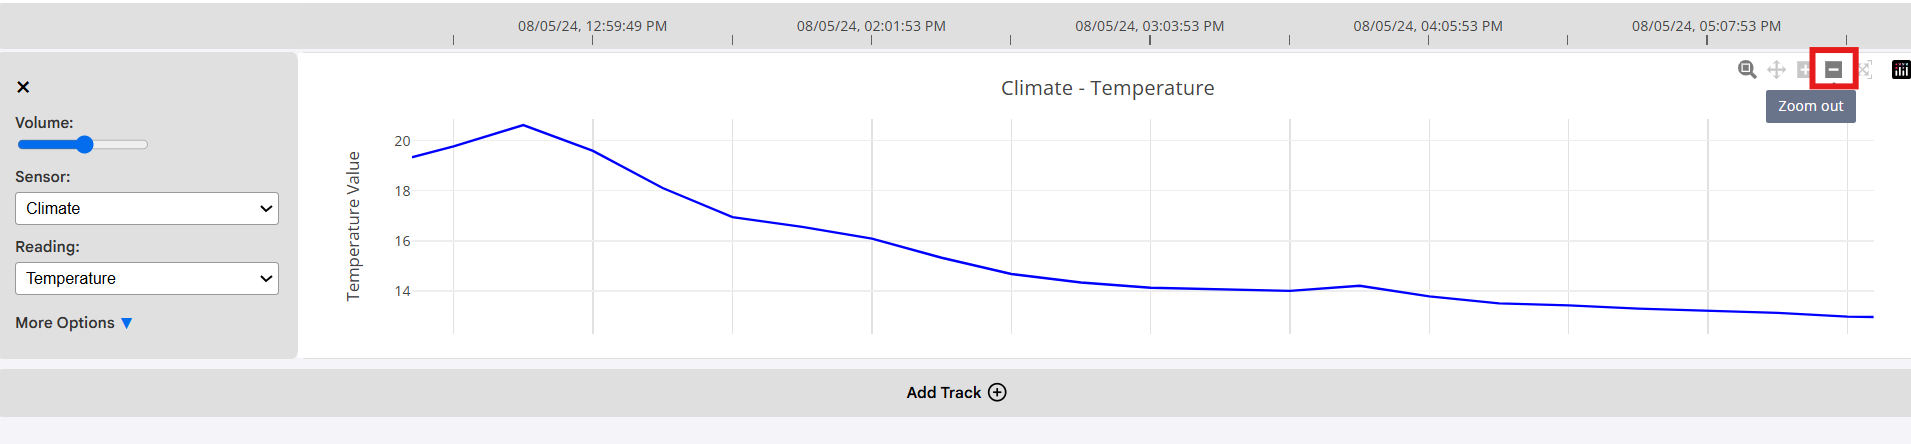
Hover over the graph again. From the selection menu, select 'Zoom Out'. This will zoom out from the center of the graph, showing a larger range of data points and trends. This is ideal for users who want to view their data in a more general way but do not want to return to the original graph with 'Autoscale.'
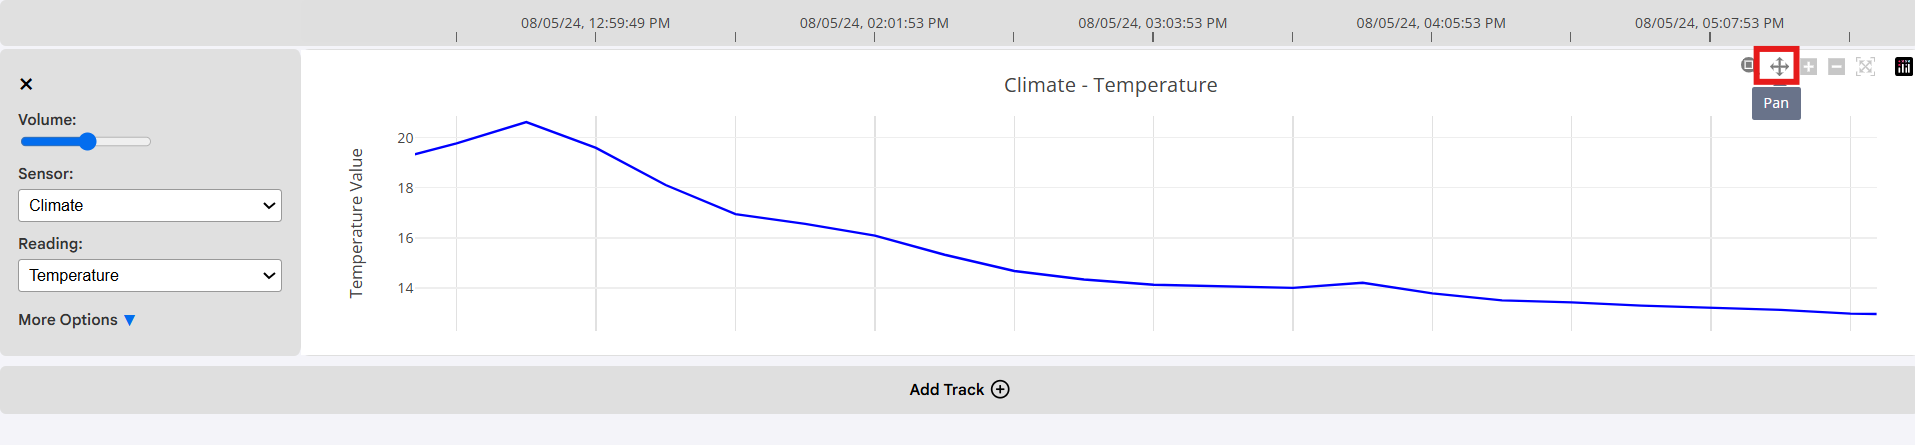
8.3 Panning
Users can hover over the graph and select 'Pan.' This features allows users to move their graph freely around its environment by holding down Left Click and dragging. Users can pair this feature with the Zoom In/Zoom Out features to view specific trends in their data. For example, a user can zoom in from the center of the graph, then pan to the right to view trends on the rightmost side of the graph in more detail.
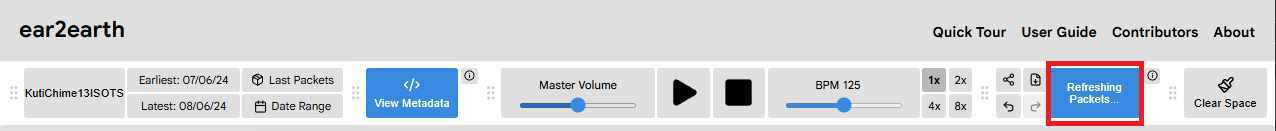
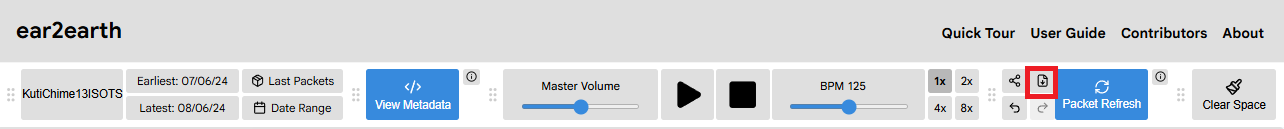
8.4 Refreshing Packets
New packets may be added to the database after a user retrieves the data. To regularly retrieve these new packets, users can select 'Refresh Packets' from the top menu. Every five minutes, data will be re-retrieved, and any new packets will be added to the track. This is ideal for users who want to view the most up-to-date data and trends without having to manually re-retrieve the data every time new packets are added. Note that if a user selects a date range that does not end in the latest date available in the database, this feature will not be accessible.

8.5 Downloading Data
Users can download their data in the form of a .csv file. When downloaded, the .csv file will contain all of the data points that were retrieved and displayed on the track, along with their associated timestamps. This is ideal for users who want to use their data for other purposes, such as data analysis or creating visualizations. There are two ways to download data. First, users can select 'Download' from the top menu. This will download a .csv file containing all of the data points that were retrieved and displayed on all tracks. This is ideal for users who want to download all of their data at once.
Secondly, users can hover over a specific track and select 'Download as CSV' from the selection menu. This will download a .csv file containing all of the data points that were retrieved and displayed on the selected track. This works for both single-axis and multi-axis tracks. This is ideal for users who want to download data from a specific track or tracks without downloading all of their data at once.
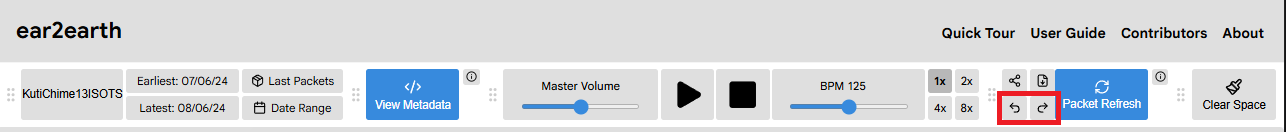
8.6 Undoing/Redoing Actions
Users can undo and redo their actions by selecting the 'Undo' and 'Redo' buttons in the top menu. This is ideal for users who want to easily reverse or reapply their most recent actions without having to manually change their settings back and forth. For example, if a user changes the sound type for a track but then decides they preferred the previous sound type, they can simply select 'Undo' to revert to the previous sound type. If they change their mind again and want to reapply the new sound type, they can select 'Redo' to reapply the change.
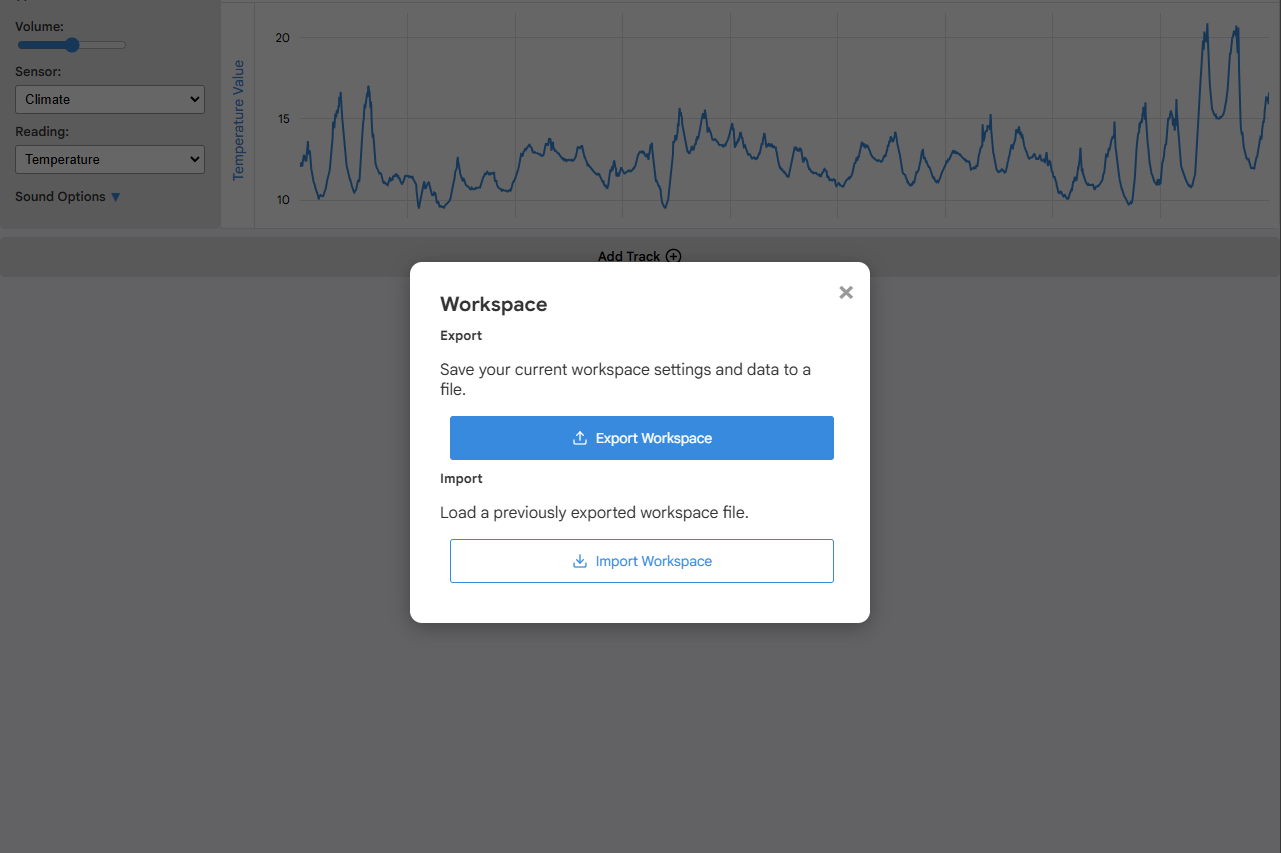
8.7 Exporting/Importing Workspaces
Users can export their workspaces in the form of a .json file. When exported, the .json file will contain all of the user's settings, including their selected database/device pair, selected sensors and readings, sound module options, and more. This is ideal for users who want to save their workspaces and return to them later or share them with others. Users can also import and load previously exported workspaces. To open the export/import menu, select 'Share' from the top menu. This will launch a selection menu where users can select 'Export Workspace' to export their workspace as a .json file or 'Import Workspace' to import a previously exported .json file.
9. Troubleshooting
9.1 Data Retrieval Failure
Sometimes, data retrieval will fail and the user will receive an error message. This is a bug we are actively working to fix. After retrieving the data again or refreshing the page, the data will most likely be retrieved without issue.
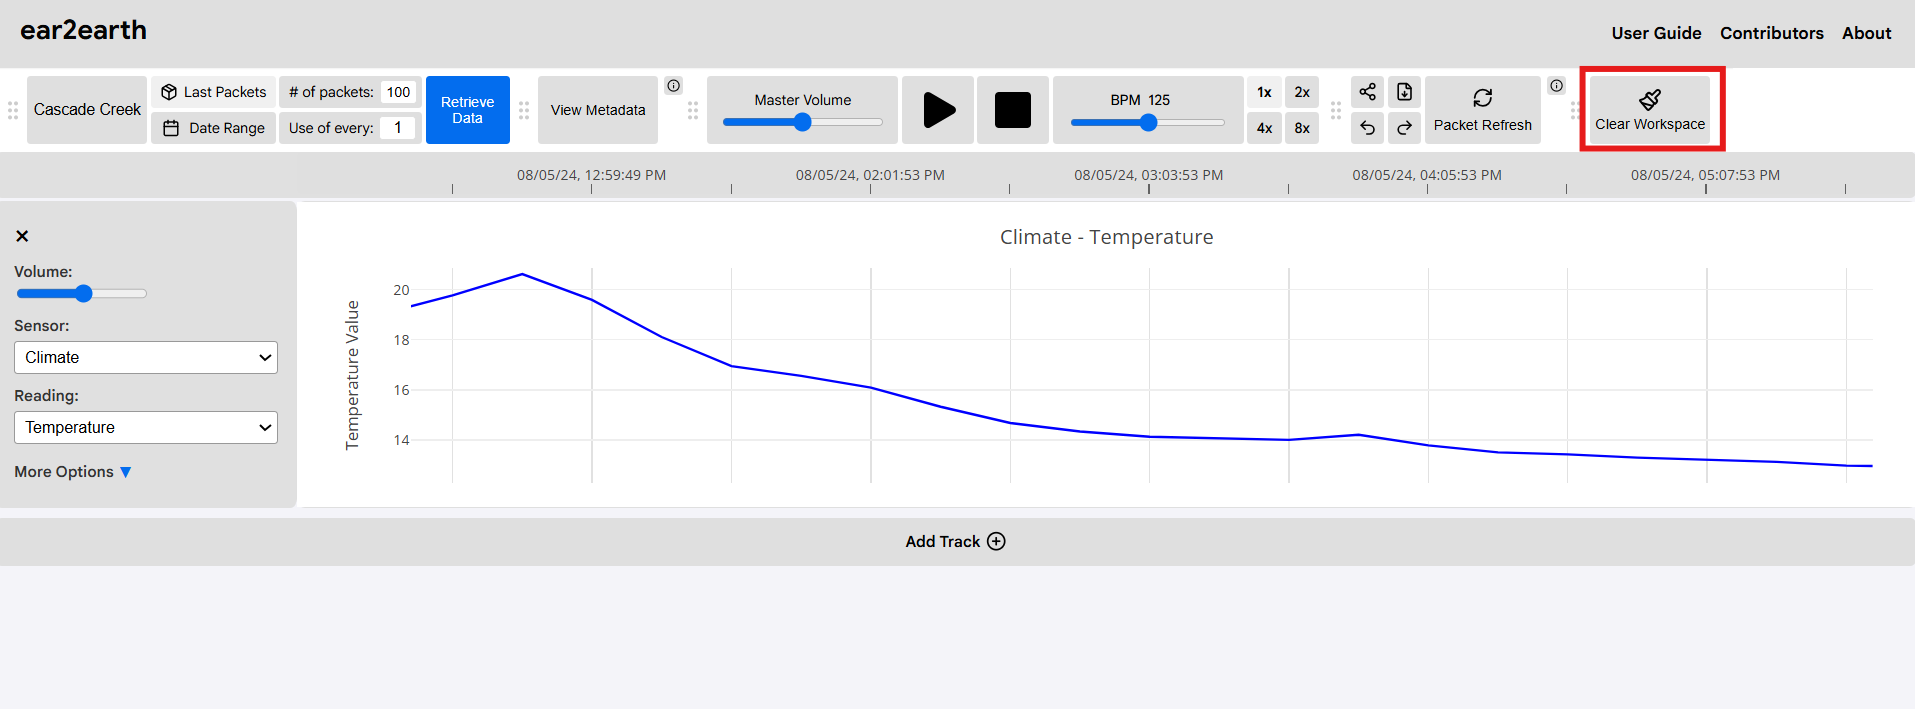
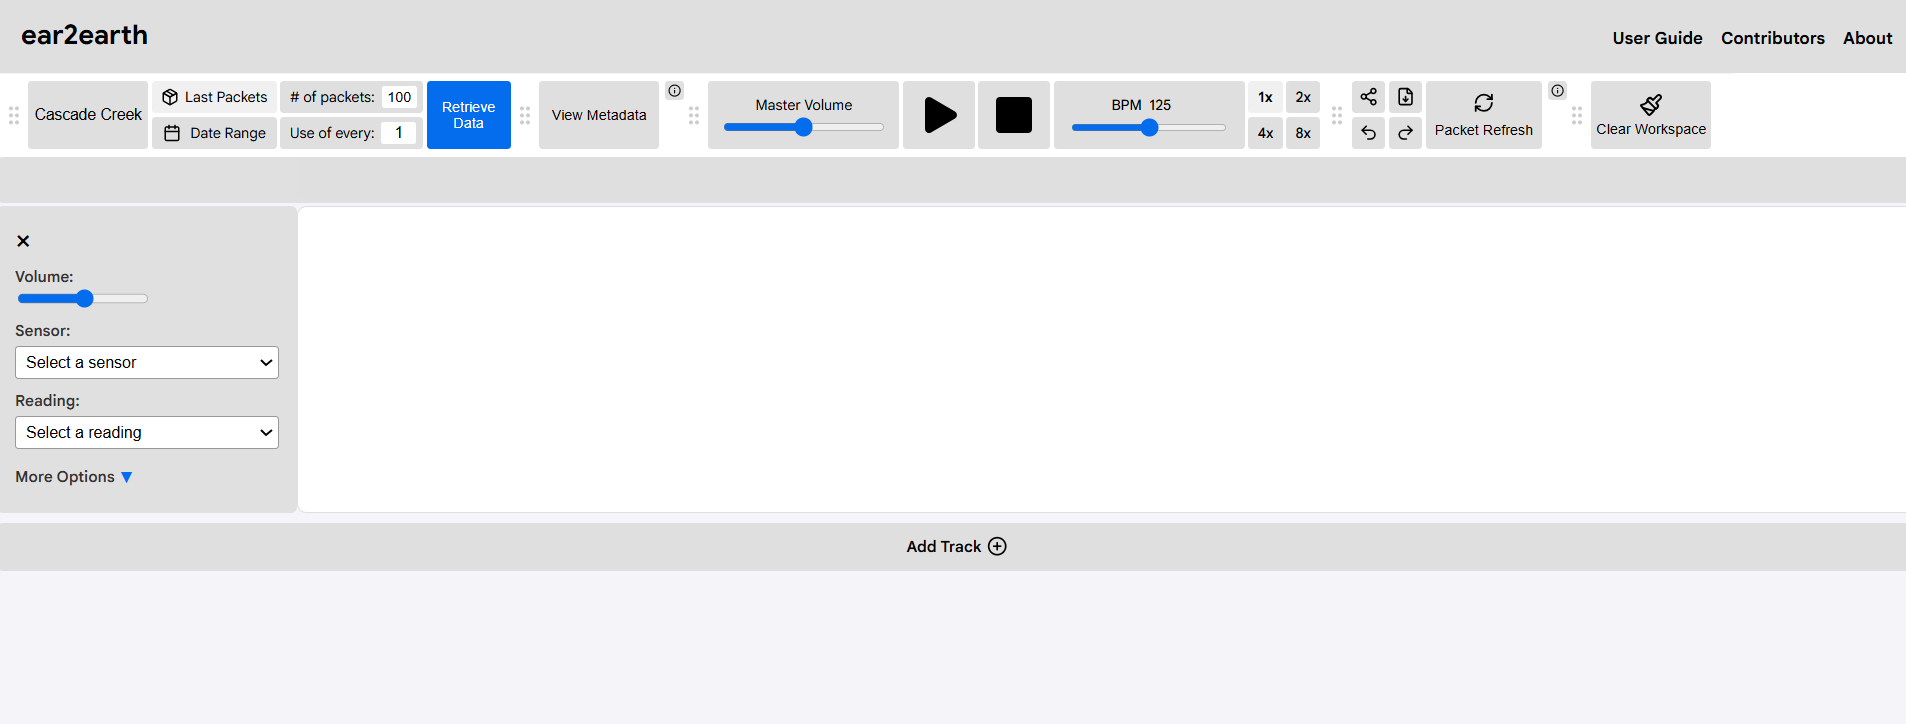
9.2 Clearing the Workspace
If a user would like to remove all items and tracks, they can do so by selecting 'Clear Workspace' from the top menu: